BUGS!

What up team?!

If you’re reading this blog, then you’re definitely among the people who know about the iOS release of Where Shadows Slumber last week. If you somehow managed to miss that news, then guess what – we released Where Shadows Slumber for iOS last week! If you have an iOS device and you haven’t gotten a chance to download it yet, you should – and if you have downloaded it, make sure you give it a 5-star review!

The whole team has been working really hard on this game for a long time, so it’s a great feeling to finally release it into the wild. On one hand, it’s very freeing – theoretically, the game is done, so I don’t have to spend all of my time working on it. On the other hand, we’re all very anxious to see if the rest of the world likes the game as much as we do. However, there’s one thing that’s on our mind right now above all else.

Bugs.

We’ve put a lot of work into making sure that Where Shadows Slumber is as stable and bug-free as possible, but with such a small team, some things are bound to fall through the cracks. Unfortunately, experiencing a bug, especially a bad one, leaves a terrible first impression. People are justifiably upset when something they’ve paid for doesn’t work – and that’s a perfect recipe for bad reviews and poor sales numbers. We’re spending this week working on addressing many of the bugs that have come to our attention, and, in the interest of transparency, I want to share some of them with all of you!


pexels-photo-276160

Unexpected Crashes

The bug: The biggest issue people have been running into so far is that the game will crash unexpectedly. This usually occurs just as a level is starting, or shortly thereafter. For most users, it will happen consistently, although some users might see sporadic crashes.

Cause: We somehow missed some poorly-compressed textures before releasing. This caused the game to consume way more memory than it should have. For older devices, or for people with something else running on the device, the operating system will kill the process to retrieve the memory, thus closing the game.

Fix: Obviously, the fix to this is to update the compression settings on the offending textures! We’re currently going through all of our assets to make sure they have the correct compression settings (along with making a few other tweaks to our memory usage).

Workaround: Until the next patch is published, the best way to play the game is on a device with enough RAM to handle the memory problems. This means either making sure that nothing else is running on your phone, or using a relatively recent device, which has enough RAM that it’s not an issue.


freezing.png

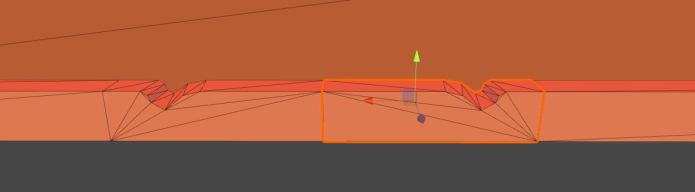
You can tell just by glancing that this level is freezing.

Unexpected Freezing

The bug: During some levels (particularly in the Hills and Summit Worlds), the game will simply freeze. The OS won’t kill the process, so it’ll still be on the screen, but nothing will be moving. Sound will still play, but the only option you have is to kill the game.

Cause: At some point, we thought it might be due to the snow particles (since it only seems to happen on snowy levels), but it seems that’s not the case. Rather, it’s due to Obe’s footprints.

Whenever Obe (or any character) takes a step, he leaves behind a little footprint. These stay around for a bit (usually up to 15 seconds), and then they disappear. This gives us the juiciness of footsteps appearing, without peppering them all over the level.
This bug is caused by some of the footprint objects (specifically the snow-related ones) having bad settings. Rather than disappearing after 15 seconds, they disappear after 150. So, when you walk around the level a lot, wayyyy too many of the footsteps are being created. The overhead of managing so many game objects is causing Unity to freeze up.

Fix: This one’s an easy one – we just updated the number from 150 back to 15. After some testing, we’re unable to reproduce this bug, so it seems like this one is in pretty good shape.

Workaround: You’ll have to beat these Levels in as few steps as possible, to reduce the number of footprints. If you can beat the Level in under two minutes, you may be able to escape the deep freeze.


summitTitlecard

Go ahead, try to click it. See? It doesn’t work!

Level “Titlecards” Not Working

The bug: A few people have mentioned this bug – apparently, the level titlecards (which let you know which level you’re about to play) will appear, but they won’t disappear when you click on them! This prevents the user from continuing into the level.

Cause: Unfortunately, our team hasn’t yet been able to reproduce this bug. We’re going to continue to try to do so on our somewhat limited range of hardware until we can figure out what’s causing it. Since the titlecards themselves are pretty simple, the cause of the bug is most likely something fairly innocuous.

Fix: Once we’re able to reproduce the bug and know the cause, it should be fairly simple to fix, as the titlecards aren’t incredibly complex.

Workaround: Until we push out a fix to this issue, the only way around it is to close the game and restart it, since you can’t access the menu from the titlecard.


ralkingblock7-5

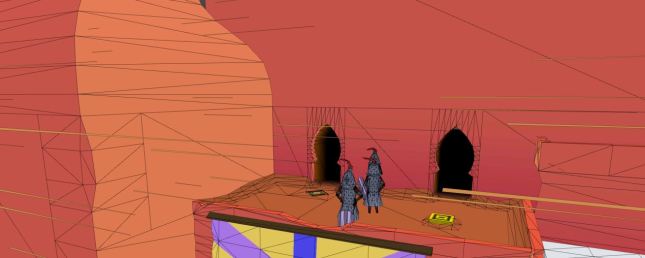
Those who’ve watched the story know that a lot of people ask Obe this question…

Disappearing Blocks

The bug: If you’re savvy enough to fight your way past the other bugs mentioned here, you might get a chance to experience this one. As the final level of the game, World 7’s fifth level is a tricky one which introduces a mechanic not seen anywhere else in the game. It involves “teleporting” blocks from one section of the level to another. Unfortunately (and apparently randomly), the blocks will disappear from one section, but never appear in the other! Obviously, this is pretty bad, since you need all of the blocks in order to complete the level, and some of them just get ejected into the æther!

Cause: When the blocks are teleported, their parent gameObjects change in Unity. I’m expecting there’s some error in the code which is causing the gameObject to inherit the wrong parent, so it doesn’t appear where it’s supposed to be. This bug has also given us some trouble in terms of reproducing. Since it’s likely an error in the code, it’s only useful to reproduce on a device where we can do some amount of development, but we have never successfully reproduced it in the Unity editor. We’re going to keep trying to do so, but do so on a variety of devices until we find the root cause.

Fix: This one is pretty straightforward, if not easy in the traditional sense. Once we determine why the blocks are disappearing, we simply have to determine how to update the logic of the mechanic to ensure that it no longer happens. Obviously, it’s more complex than that, but I don’t want to get into the nitty-gritty of it here (especially since I don’t know what the exact fix would be).

Workaround: Aside from the bug that literally prevents you from playing the game, this is the workaround that I’m least happy with – the only way to fix this issue is to reset the entire level through the menu. Since it’s such a long level, that means losing a good bit of work. We’re working on all of these bugs, but this one in particular I want to fix. Since it’s the last level of the game, and you lose so much progress when you restart it, the user ends up with a bitter taste in their mouth, which is exactly how we don’t want players to finish Where Shadows Slumber.


Burnout

Other Issues?

Of course, these aren’t all of the bugs. That’s one of the first things you realize when you let someone else use a piece of software you’ve created – there’s always a fresh horror just around the corner. This list is just the biggest offenders we’ve discovered so far. I can personally guarantee that there are others, and I’m tasking each and every one of you with finding them!

If you do happen to stumble across a bug that I haven’t discussed here, there are a few things you can do for us:

  • Tell us about it! We’re active on Facebook and Twitter, and you can always shoot us an email at contact@GameRevenant.com or join our Discord Channel. If you do, make sure you include details about your device. We want to make Where Shadows Slumber as awesome as possible, but we can’t fix bugs we don’t know about!
  • See if it happens repeatedly, and if there’s some pattern to when and how it’s happening. This helps us immensely when we’re trying to reproduce the bugs. After all, it’s a lot harder for us to fix a bug that we can’t reproduce. Screenshots are great too!
  • Don’t leave a disparaging review. All too often, we see people giving us a poor rating and review because of a bug. In a lot of these cases, it definitely makes sense – you paid for a product, and it’s broken. One out of five! The problem with this is that reviews and ratings are our best way to get other people to start playing the game. If our ratings start to tank, nobody is going to download the game! It’s definitely better to tell us about a bug and help us fix it than to simply hurt us by leaving a bad review (and then not updating it when we fix the bug, thus leaving us with a permanent scar on our rating).
  • Share app analytics with the developers. I think that this is a setting somewhere in iOS that will share data and statistics about app crashes. A detailed email from you is usually better (because not all bugs count as “crashes”), but checking this allows Apple to send the crash logs straight to us.


Thanks for taking the time to read about some of the bugs we’ve experienced. Putting something that we’ve worked so hard on out into the wild is always a big question mark. We’re happy with the amount of publicity we’ve managed to stir up, but we’re also a little annoyed by these bugs, as I’m sure many of our players are. We want to make sure that you all know that we know about these issues, and we’re doing everything we can to fix them as fast as possible.

If you are experiencing these bugs, never fear! We’re fixing the major ones, so you can keep your eyes peeled for a new version of Where Shadows Slumber later this week! Once it comes out and you update the app on your phone, some of these bugs (and maybe some others) should be taken care of.

Next week we’ll share more details about how our iOS launch is going!


= = = = = = = = = = = = = = = = = = = = = = = = = = = = = = = = = = = =

You can always find out more about our game (and tell us about bugs) at WhereShadowsSlumber.com, find us on Twitter (@GameRevenant), Facebookitch.io, or Twitch, join the Game Revenant Discord, and feel free to email us directly with any questions or feedback at contact@GameRevenant.com.

Jack Kelly is the head developer and designer for Where Shadows Slumber.

Crunch and Burn(out)

If you’ve been following the development of Where Shadows Slumber, then you know that we’ve been working on it for a while. It was early 2015 when the core concept first came to me. Three years ago this month was when I put together the first proof-of-concept to show to Frank. The demo version of the game has been out for over a year and a half.

Game development takes a long time, especially with a tiny team, little to no funding, a full-time job, and, the biggest time-waster of all, life itself. As Frank discussed in a previous blog post, we are holding ourselves to a pretty high standard for Where Shadows Slumber, which makes development even slower.

Fortunately, after all this time, we’re finally closing in on the end. As happy as that might make you, the fans of the game, there are two people who are definitely happier about it than you are: us. As frustrated as you might be about how long it’s taking, we’re even more frustrated. Frankly, as much as we love Where Shadows Slumber, neither of us can wait until the moment it’s over.

“But Jack”, you ask incredulously, “if you love it, why do you want it to be over? You’ve managed to work on it for three years – what’s another few months?”

There are two phenomena that often creep up at around the same time in the development cycle of a game (or any project, really). Here they both are, followed by something I’ve said in the past week that represents each of them:

  • Crunch – “There’s only a little bit of work left, but there’s even less time left!”
  • Burnout – “I’ve spent so long on this game, I’m just sick of it!”


Night.jpg

Crunch

I’ve discussed before the “ninety-ninety” rule, so I’ll just summarize it quickly here, since it’s relevant: not only does software development take a long time, it takes significantly longer than you think it will. This is an issue when you first start your project (“it’ll probably only take 18 months or so”), but there’s no scheduled release date or external pressure at that point. Nobody really cares yet! However, it becomes a bigger issue when dealing with shorter time periods. For some reason, people have a hard time realizing that their estimates are wrong and adjusting (at least, we do). Because of that, we’re still making poor estimates for how long something will take!

This is the reason that developers inevitably end up in the dreaded state known as crunch time. We thought there were about 6 weeks of work left, but it turns out there were 12 weeks of work left. Too bad we already gave a bunch of outside parties a solid release date! Since they’re now depending on us to meet those deadlines, we have to do 12 weeks worth of work in 6 weeks!

This is the phenomenon that leads to crazy overtime, too many all-nighters, and an incredible amount of stress. If you follow game design, you’ve probably heard about it, because it somehow ends up happening to pretty much every game. If you’re involved in game design, then you’ve probably gone through it, and you know how awful it can be.

It’s a little better for us than for bigger, more established studios – we don’t have employees to pay, stockholders to appease, or a public release date to hit. That said, we don’t want Where Shadows Slumber to turn into an indie game for which development takes forever that people are perennially waiting for. It’s now or never!


Burnout.png

Burnout

Cascading into crunch time at full speed is pretty bad, but it’s not the worst thing in the world – we’re been working on Where Shadows Slumber for a long time, and we are both willing to put in a little extra time as we reach the end. However, one of the biggest problems is that crunch time is also usually accompanied by burnout.

When you’re just starting out on a project, everything is pretty exciting. You enjoy working on interesting problems like pathfinding and game mechanics, and you don’t even mind fixing any bugs that come up. On the other hand, once you’ve been working on a game for a long time, you’re pretty much sick of it. All of the interesting stuff is already implemented, so the only things left to work on are tiny quality improvements (“does this look better when the position is 0.4 or 0.41? How about 0.42?”), annoying, subtle, or hard-to-reproduce bugs (“this was working last week, but a change to a different piece of code is somehow causing it to break, but only ~10% of the time”), and tasks that you intentionally avoided because they aren’t interesting or fun (“how many setPass calls will this scene render when running on a 6-year old Android phone? Is that too many?”).

None of these tasks are really very enjoyable – so not only has your excitement about the work decreased, but so has the objective fun-ness of the work that’s left to do. This leaves you in a state of never actually wanting to work on the project. Combine that decreased drive with the increased amount of work you have to do, and it starts to become pretty obvious why the end of development for a game tends to get pretty hairy, and why we’re looking forward to being done with it.


Tunnel.jpg

The Light at the End of the Tunnel

Don’t worry, though – it’s not all bad! We’re both still really excited about Where Shadows Slumber, because of the amount of work we’ve put into it. We’re both dedicated to the cause, and we’re not gonna let a little extra work put a stop to it (even if it ends up slowing us down).

The purpose of this blog post is two-fold. On one, more selfish hand, I want to offer up to our adoring fans an explanation for why we haven’t finished the game yet. We know a lot of you love the game, and are really looking forward to it, and many of you have shown us that by popping up and saying hi at various conventions. The past 8 months or so have been a real whirlwind, both personally and professionally, and our timeline has been shifting around quite a bit as a result. So I wanted to offer a bit of an explanation, as well as reassure you that we’re still working on Where Shadows Slumber, and we’re not gonna let it fall by the wayside!

The other reason for this post is to serve as a sort of warning, albeit a likely redundant one. For anyone working on their own game (or any project, really), it’s very important to take time management seriously. Ending up in the crunch time/burnout trap is an awful place to be. Despite this, most developers (indie and AAA alike) end up here, because it’s hard for people to grasp how time-consuming the last 10% of a project can be. So, if you take away anything from this post, I hope you do your best to allow enough time at the end of development to get your game out without ending up there. You’ll end up there anyway, but maybe by knowing about it ahead of time, you won’t be there for long.


= = = = = = = = = = = = = = = = = = = = = = = = = = = = = = = = = = = =

You can always find out more about our game and how freaking long it’s taking us to finish it at WhereShadowsSlumber.com, find us on Twitter (@GameRevenant), Facebookitch.io, or Twitch, join the Game Revenant Discord, and feel free to email us directly with any questions or feedback at contact@GameRevenant.com.

Jack Kelly is the head developer and designer for Where Shadows Slumber.

Unity’s Performance Debugging Tools

Last week I discussed some of the basics of how rendering works in Unity. As I mentioned, all of that was setup for this week’s blog post. Since I’m working on rendering optimization now, I figured it would be a great time to go over the debugging tools Unity provides in order to aid rendering performance. Online resources can be a little scarcer for rendering than they are for other aspects of coding, so hopefully anyone who’s working on their own game might glean some useful information from this post. And even if you’re not working on anything right now, I hope you follow along and maybe learn a bit!

Unity is a nice little game engine, and, as such, it does a lot of the work for you. For the most part, when making a game, you don’t have to worry about the nitty-gritty stuff like rendering. When building for mobile, however (especially when you have specific graphics/lighting customization), you might have to descend into shader-land. Fortunately, Unity provides a few tools that can help you to deal with optimizing your rendering pipeline.


4-24-Profiler.JPG

Profiler

The first step in fixing rendering performance issues is to know about them. The best way to do that is with the Profiler window (Window -> Profiler). While you’re running your game, the Profiler keeps track of a lot of incredibly useful information, like how long each frame takes to render, split up by category. For instance, the Profiler will tell me that a frame took 60 milliseconds to run, 40 of which were due rendering and 15 from script execution, etc. This is the first place you should check when trying to improve performance – there’s no point in optimizing your rendering if it’s actually your scripts that are running slowly!

profiler

So much information!

For the purposes of rendering, there’s an entire Profiler section! The Rendering Profiler keeps track of the number of batches, setPass calls, triangles, and vertices in each frame. Looking here for inconsistencies, spikes, and just high numbers in general is a good way to get an idea of why your game is taking so long to render. The Profiler also has a lot of other info that’s useful for diagnosing and debugging performance problems. I really recommend profiling your game and thoroughly looking through the results to get as much information about how your game is running as possible.


android_debug_bridge

Android Debug Bridge

While profiling in the editor is pretty useful, it doesn’t tell us much – of course our game will be fast on a great big computer, but how does it run on a crappy phone?

The is where ADB, or the Android Debug Bridge, comes in. ADB allows your computer to communicate with your Android phone about all sorts of stuff. Specifically (for our use cases), it allows you to profile your game while it’s running on a device. If you plug your phone into your computer, build the game directly to your phone, and open the profiler, you should see some results. This is the information we want, because it tells a much truer story about how your game runs on a phone.

Where Shadows Slumber, for instance, runs at ~200 fps in the Unity editor. When I plug my phone (the Google Pixel 2) into the profile, I get a framerate of ~60 fps. This is pretty good, so I know our game can run on newer devices. However, when I plug in my old phone (a broken HTC One M8), I get closer to ~12 fps. Looking at the profile during this run will give me much more useful information about what I should fix, since this is the device where performance is actually suffering. If you’re making any big decisions or changes based on profiler results, make sure those results come from your actual targeted device, and not just from the editor.

ADB usually comes with the Android SDK – if you have the Android SDK set up with Unity (which allows you to build to Android devices), then you should be able to use ADB with the profiler pretty painlessly.

I should also mention that there might be an equivalent tool for iOS debugging, but, as I do all of my development on a Windows machine, and all of my testing on an Android phone, I wouldn’t know what it is. Sorry!


4-24-Header

Frame Debugger

The next most important tool for rendering performance is the Frame Debugger (Window -> Frame Debugger). While the Profiler tells us a lot about what’s happening during rendering as a whole, it still treats the rendering process as a black box, not letting us see what’s actually happening. The is where the Frame Debugger comes in – it allows us to see, step by step, exactly what the GPU is doing to render our scene.

As I mentioned last week, the GPU renders the scene through a bunch of draw calls. The Frame Debugger allows us to see what each of those draw calls is drawing. This allows us to determine which materials/shaders are causing the most draw calls, which is one of the biggest contributors to rendering lag. It also provides a bunch of information about each draw call, such as the properties passed to the shader or geometry details. The important thing that it tells you is why this draw call wasn’t batched with the previous draw call.

frame debugger

All of this happens in a single frame

Batching is Unity’s first defense against rendering lag, so it makes sense to batch as much stuff into a single draw call as possible. Because rendering is such a complex process, there are a lot of reasons why draw calls can’t be batched together – certain rendering components simply can’t be batched, meshes with too many vertices or negative scaling can’t be batched, etc. The frame debugger will tell you why each draw call isn’t batched with the previous one, so you can determine if there are any changes you can make that might reduce the number of draw calls, thereby improving rendering performance.

For example, in Where Shadows Slumber, we re-use meshes in certain places. Sometimes, if we require a “mirrored” look we’ll reuse a mesh, and then set the scale to -1. This was before we really looked into rendering performance, and, unfortunately, it causes problems – a mesh with negative scaling can’t be batched with a mesh with positive scaling, so this ends up creating multiple draw calls. Rather than setting the scale of the object to -1, we simply import a new, mirrored mesh and update the object, allowing these draw calls to be batched and improving performance.


4-24-Stats.JPG


Stats

That’s it for the heavy-hitters; between the Profiler, Frame Debugger, and ADB, you should be able to get a pretty good idea of what’s going on in render-land. Unfortunately, digging through them can take a while – sometimes you just want a quick indicator of what’s going on in your scene. Enter the Stats window.

The Stats window (click “Stats” in the Game View) is a small overlay in the game view which gives you a quick rundown of various rendering indicators in real time. It’s not as in-depth, but it gives a much quicker picture of performance.

stats

That’s a lot of batches!

While it sounds like the stats window doesn’t add much – after all, the Profiler can give you the same information – I’ve found it to be very useful. The Profiler is probably better when you’re actively debugging rendering performance, but the stats window allows you to notice places where rendering performance might take a hit, even when you’re doing other things.

When I’m testing some other part of the game on my computer, I’m not going to notice any rendering lag, because my computer is so much more powerful than a phone. I’m also not going to be looking at the Profiler or Frame Debugger, because I’m not worrying about rendering at the moment. However, if I have the stats window open and I notice that the number of draw calls is in the hundreds, then I know something is going on. At that point I can get out the Profiler and see what’s happening – but I wouldn’t even have known there was anything amiss if it weren’t for the stats window.


4-24-SceneView.JPG

Scene View Draw Mode

As we get further and further down the list, we’re moving from “debugging all-star” to “it’s useful, but you probably won’t use it much”. Scene View Draw Modes fall into this category, but they’re still good to know about. You can access different Scene View Draw Modes by clicking the drop down menu at the top right of the scene view window.

The Scene View in Unity is one of the main windows that you use to make your game – it shows everything in the scene, allowing you to move around through the scene and select, move, rotate, scale, etc., any game objects. Usually the Scene View just displays the objects exactly as they would be displayed in the game. However, it has a bunch of other modes, and some of them are actually pretty useful. The two that I find the most useful when considering rendering concerns are listed below, although they’re all worth checking out:

Shaded Wireframe: This is my default draw mode, as it looks pretty similar to the normal shaded mode. The difference is that it also shows all of the triangles and vertices that you’re drawing. This is useful because certain shader operations are performed once for every vertex. Decreasing the number of vertices in your scene can give you a bit of a performance boost, and the shaded wireframe draw mode helps you see when you might have too many vertices.

3-4toomanytris

The shaded wireframe shows that there are too many polys.

Overdraw: This mode draws each object as a single transparent color. This makes it very easy to see when multiple objects are being drawn in the same spot on the screen. Since the GPU has to draw every pixel of each object (even if that pixel will be overwritten later), it ends up wasting some calculations. Areas that are very bright will waste even more calculations. Switching to this draw mode every so often lets you know if there are any places where you might want to remove some meshes.


161004-worst-hacks-history-feaure

The Internet!

It should pretty much go without saying, but one of your best resources for debugging performance is the internet. Unfortunately, when it comes to rendering in Unity, the information out there is pretty scarce. Unlike with normal imperative coding, where you can simply Google “how to pathfinding” and get 30 implementations, you have to work a bit harder with rendering stuff. I find it’s best to do what you can and only resort to the internet with very specific questions. That said, there is still a lot of helpful information out there. You just have to know going in that only one of every three stack overflow questions makes any sense, and only one of every four Unity forum threads are using the most recent APIs. It’s like “Googling: Nightmare Mode”!

For anyone reading this post who is actually working on rendering stuff – I’m very, very sorry. I hope that this post and the tools I discussed help to shed at least a little bit of light in the dark underworld that is shader-land, and I hope you can achieve your rendering goals and make it back to the mortal realm before your soul is forever lost.

For everyone else who hasn’t done any rendering stuff, I hope you learned a bit, and that maybe I inspired you to get involved with some rendering code! It’s really not that bad, I promise!


= = = = = = = = = = = = = = = = = = = = = = = = = = = = = = = = = = = =

If you didn’t already have a working knowledge of rendering, I hope this post helped! If you do know about rendering stuff, I hope you don’t hate me too much for my imprecision! You can always find out more about our game at WhereShadowsSlumber.com, find us on Twitter (@GameRevenant), Facebookitch.io, or Twitch, join the Game Revenant Discord, and feel free to email us directly with any questions or feedback at contact@GameRevenant.com.

Jack Kelly is the head developer and designer for Where Shadows Slumber.

Rendering in Unity

As you probably know, Where Shadows Slumber is starting to ramp up toward a release this summer. It’s an exciting, terrifying time. We can’t wait to share the entirety of what we’ve been working on with the world, but there’s also a daunting amount of stuff to do, and not much time to do it.

If you’ve played any of the recent beta builds, hopefully you like what you’re seeing in terms of design, functionality, polish, art, and sound. Unfortunately, if you’ve played the beta on anything other than a high-end device, you’ve probably noticed something that you don’t like: lag.

Lag is annoying. Lag is something that can take a great game and ruin it. It doesn’t matter that your level design is perfect, your models are beautiful, and your music is entrancing if it only runs at 10 frames per second. If that’s the case, nobody is going to enjoy playing it. And, regrettably, that happens to be the case for Where Shadows Slumber.

LikeButta

Like butta’!

So, one of my biggest tasks before we release is to optimize the game, making it run faster and allowing us to have higher frame rates. The area with the most opportunity for improvement is during rendering. A game consists of a lot of logic – Obe’s location, things changing in shadow, etc. – but rendering is the process of actually drawing the scene onto the pixels of your screen.

Earlier this week, I started a post about the different tools you can use to help optimize your rendering performance. It seemed like a good idea, since that’s exactly what I was doing. However, I realized that if you don’t know how rendering works in the first place, most of it is complete gibberish. So I’m gonna leave that post for next week, and this week I’ll give a quick introduction to how 3D rendering works in Unity.

Blog-Render.JPG

Rendering

Rendering is the process by which the objects in your game are drawn to the screen. Until it’s rendered, an object in your game is just a collection of information about that object. That information gets translated from information the game engine understands into information the GPU can understand. There are a few important concepts to understand here:

  • An object’s mesh describes the shape of the object. It consists of a collection of vertices and triangles.
  • An object’s material is a description of how that object should be drawn. It encapsulates things like colors and shininess.
  • Every material uses a shader. This is the program which calculates exactly what color each pixel should be, based on the information in the mesh and material.
  • World space is the 3D coordinate space in which all of your game objects live.
  • Screen space is a 2D coordinate space that represents the screen to which the game is drawn.

The basics of rendering are pretty easy to understand, at least from a high-level view. The meshes for the objects in your game are translated from world space to screen space, based on the camera that’s doing the rendering. For instance, in Where Shadows Slumber, objects that are further away in the x-axis will be higher up and more to the right when viewed on the screen. Fortunately, we don’t have to mess with this too much – Unity’s cameras do a good job of making this translation.

Once we know where each pixel should be drawn, we need to determine what color that pixel should be – this is where the material and shader come in. Unity provides a whole bunch of information to the shader (position, angle, information about lights in the scene, etc.). The shader uses that information, plus the information from the material, to determine exactly what color the given pixel should be. This happens for every pixel on the screen, resulting in a beautiful picture of exactly what you expect to see.

The GPU

Now that we understand the basics of rendering, let’s take a deeper look into how it actually happens: the GPU.

The GPU, or graphics processing unit, is the part of the computer in charge of calculating the results of our shaders to determine a pixel’s color. Since modern phones have over 2 million pixels, our shader code must be run over 2 million times per frame – all within a fraction of a second.

How does the GPU manage to do so many calculations so quickly? It’s due to the design of the GPU, and can be summed up in one very important sentence: the GPU is good at performing the same operation, a bunch of times, very quickly. The key thing to remember here is that it’s good at performing the same operation; trying to perform different operations is what slows it down.

Specifically, switching from one material to another causes a bit of a hiccup in terms of speed. The properties of the material are passed to the GPU as a set of parameters in what is known as a SetPass call. SetPass calls are one of the first and most important indicators when it comes to optimizing rendering performance, and are often indicative of how quickly or slowly your game will run.

Because SetPass calls take so long, Unity has a strategy for avoiding them called batching. If there are two objects that have the same material, that means they have the same parameters passed to the GPU. This means that those parameters don’t need to be reset in between drawing the two objects. These two objects can be batched, so the GPU will draw them at the same time. Batching is Unity’s first line of defense against rendering slowness.

The CPU

While the GPU is the star of the show when it comes to rendering, the CPU, or central processing unity, still does some important stuff that’s worth mentioning (even if it doesn’t have a huge bearing on the optimization steps we’ll be taking). Of course, the CPU is in charge of running your game, which includes all of the non-shader code you’ve written for it, as well as any under-the-hood things Unity is doing, like physics and stuff.

The CPU does a lot of the “set up” for rendering, before the GPU comes in and does the heavy number-crunching. This includes sending specific information to the GPU, including things like the positions of lights, the properties of shadows, and other details about the scene and your project’s rendering config.

One of the more important rendering-related things the CPU does is called culling. Since the CPU knows where your camera is, and where all of your objects are, it can figure out that some objects won’t ever be viewed. The GPU won’t know this, and will still perform calculations for those objects. In order to avoid doing these unnecessary calculations, the CPU will first remove any of the objects that won’t be drawn, so the GPU never even knows about them.

Image

All of these Hitlers would be culled by the CPU (image credit: smbc-comics.com)

Since we’re talking about performance, it should be noted that the GPU and the CPU are two different entities. This means that, if your game is experiencing lag, it’s likely due to either the GPU or the CPU, but not both. In this case, improving the performance of the other component won’t actually make your game run any faster, because you’ll still be bottlenecked by the slower process.

So, now that we know a little bit more about how rendering actually happens, maybe we can use that knowledge to improve performance! At least, that’s what I’m hoping. If Where Shadows Slumber never comes out, then you’ll know I’ve failed. Either way, I’ll see you next week for a look into the tools you can use to help you optimize rendering performance in Unity!


= = = = = = = = = = = = = = = = = = = = = = = = = = = = = = = = = = = =

If you didn’t already have a working knowledge of rendering, I hope this post helped! If you do know about rendering stuff, I hope you don’t hate me too much for my imprecision! You can always find out more about our game at WhereShadowsSlumber.com, find us on Twitter (@GameRevenant), Facebookitch.io, or Twitch, join the Game Revenant Discord, and feel free to email us directly with any questions or feedback at contact@GameRevenant.com.

Jack Kelly is the head developer and designer for Where Shadows Slumber.