Unity’s Performance Debugging Tools

Last week I discussed some of the basics of how rendering works in Unity. As I mentioned, all of that was setup for this week’s blog post. Since I’m working on rendering optimization now, I figured it would be a great time to go over the debugging tools Unity provides in order to aid rendering performance. Online resources can be a little scarcer for rendering than they are for other aspects of coding, so hopefully anyone who’s working on their own game might glean some useful information from this post. And even if you’re not working on anything right now, I hope you follow along and maybe learn a bit!

Unity is a nice little game engine, and, as such, it does a lot of the work for you. For the most part, when making a game, you don’t have to worry about the nitty-gritty stuff like rendering. When building for mobile, however (especially when you have specific graphics/lighting customization), you might have to descend into shader-land. Fortunately, Unity provides a few tools that can help you to deal with optimizing your rendering pipeline.


4-24-Profiler.JPG

Profiler

The first step in fixing rendering performance issues is to know about them. The best way to do that is with the Profiler window (Window -> Profiler). While you’re running your game, the Profiler keeps track of a lot of incredibly useful information, like how long each frame takes to render, split up by category. For instance, the Profiler will tell me that a frame took 60 milliseconds to run, 40 of which were due rendering and 15 from script execution, etc. This is the first place you should check when trying to improve performance – there’s no point in optimizing your rendering if it’s actually your scripts that are running slowly!

profiler

So much information!

For the purposes of rendering, there’s an entire Profiler section! The Rendering Profiler keeps track of the number of batches, setPass calls, triangles, and vertices in each frame. Looking here for inconsistencies, spikes, and just high numbers in general is a good way to get an idea of why your game is taking so long to render. The Profiler also has a lot of other info that’s useful for diagnosing and debugging performance problems. I really recommend profiling your game and thoroughly looking through the results to get as much information about how your game is running as possible.


android_debug_bridge

Android Debug Bridge

While profiling in the editor is pretty useful, it doesn’t tell us much – of course our game will be fast on a great big computer, but how does it run on a crappy phone?

The is where ADB, or the Android Debug Bridge, comes in. ADB allows your computer to communicate with your Android phone about all sorts of stuff. Specifically (for our use cases), it allows you to profile your game while it’s running on a device. If you plug your phone into your computer, build the game directly to your phone, and open the profiler, you should see some results. This is the information we want, because it tells a much truer story about how your game runs on a phone.

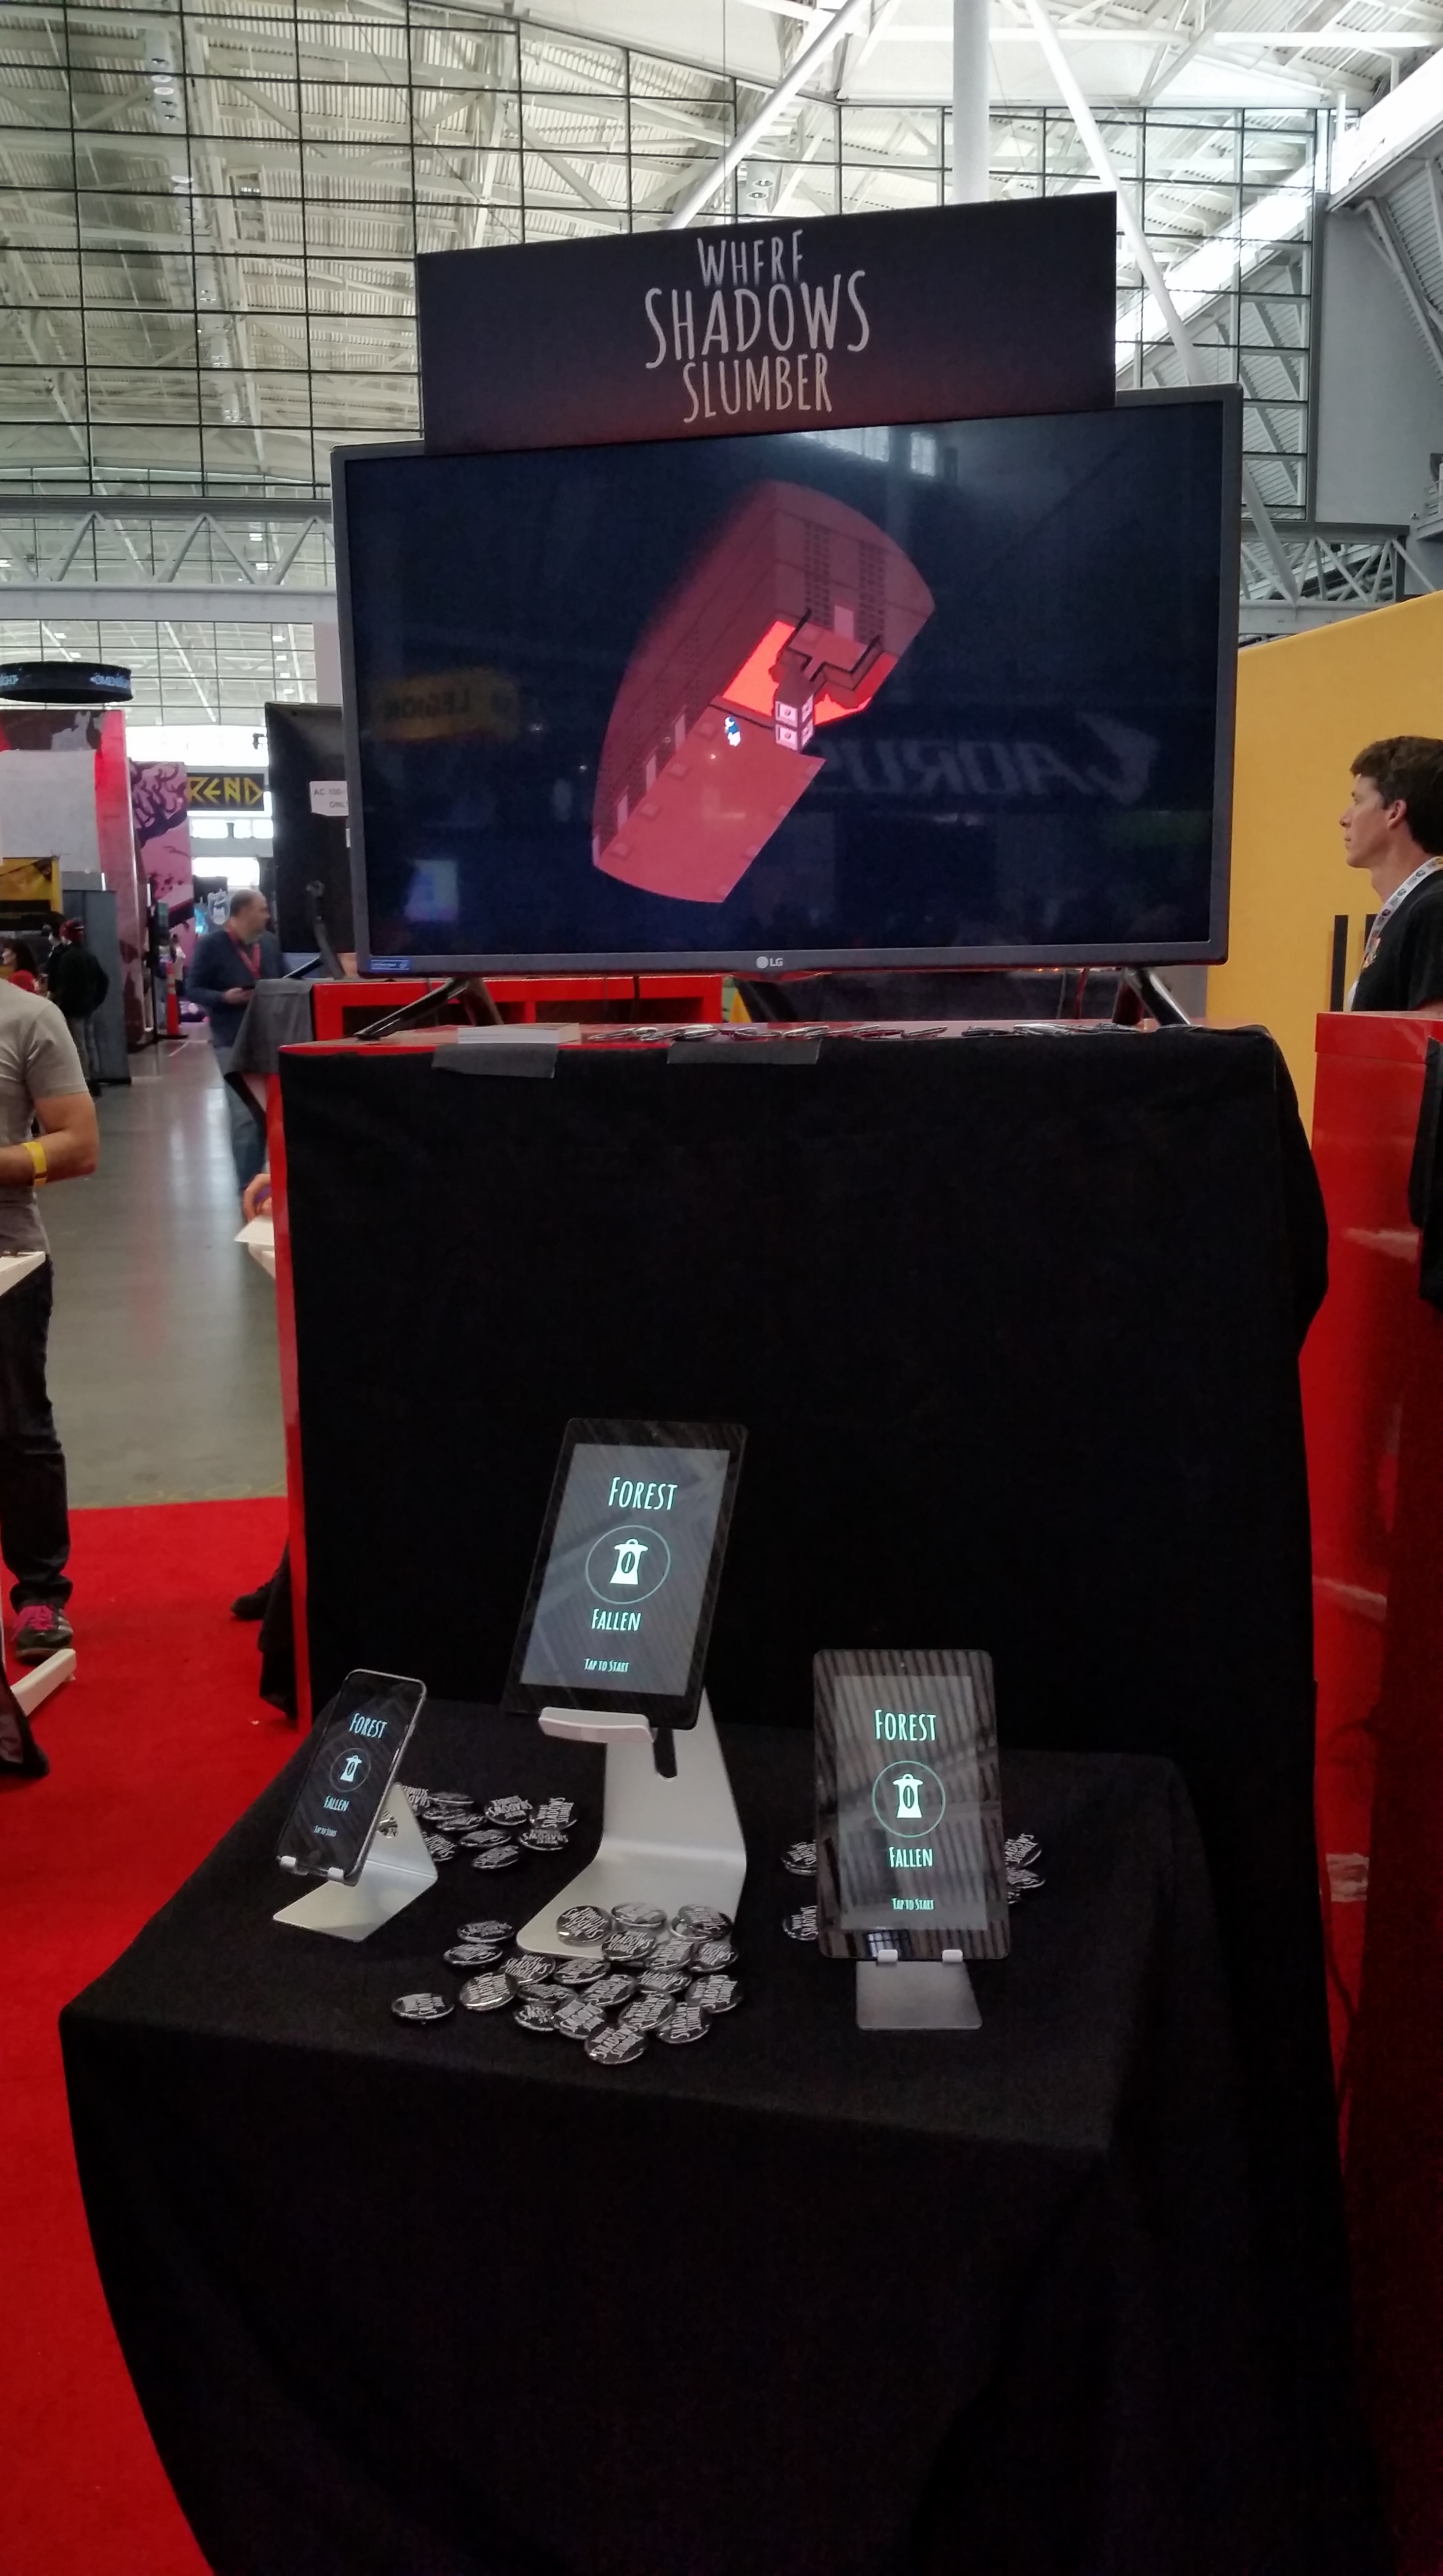
Where Shadows Slumber, for instance, runs at ~200 fps in the Unity editor. When I plug my phone (the Google Pixel 2) into the profile, I get a framerate of ~60 fps. This is pretty good, so I know our game can run on newer devices. However, when I plug in my old phone (a broken HTC One M8), I get closer to ~12 fps. Looking at the profile during this run will give me much more useful information about what I should fix, since this is the device where performance is actually suffering. If you’re making any big decisions or changes based on profiler results, make sure those results come from your actual targeted device, and not just from the editor.

ADB usually comes with the Android SDK – if you have the Android SDK set up with Unity (which allows you to build to Android devices), then you should be able to use ADB with the profiler pretty painlessly.

I should also mention that there might be an equivalent tool for iOS debugging, but, as I do all of my development on a Windows machine, and all of my testing on an Android phone, I wouldn’t know what it is. Sorry!


4-24-Header

Frame Debugger

The next most important tool for rendering performance is the Frame Debugger (Window -> Frame Debugger). While the Profiler tells us a lot about what’s happening during rendering as a whole, it still treats the rendering process as a black box, not letting us see what’s actually happening. The is where the Frame Debugger comes in – it allows us to see, step by step, exactly what the GPU is doing to render our scene.

As I mentioned last week, the GPU renders the scene through a bunch of draw calls. The Frame Debugger allows us to see what each of those draw calls is drawing. This allows us to determine which materials/shaders are causing the most draw calls, which is one of the biggest contributors to rendering lag. It also provides a bunch of information about each draw call, such as the properties passed to the shader or geometry details. The important thing that it tells you is why this draw call wasn’t batched with the previous draw call.

frame debugger

All of this happens in a single frame

Batching is Unity’s first defense against rendering lag, so it makes sense to batch as much stuff into a single draw call as possible. Because rendering is such a complex process, there are a lot of reasons why draw calls can’t be batched together – certain rendering components simply can’t be batched, meshes with too many vertices or negative scaling can’t be batched, etc. The frame debugger will tell you why each draw call isn’t batched with the previous one, so you can determine if there are any changes you can make that might reduce the number of draw calls, thereby improving rendering performance.

For example, in Where Shadows Slumber, we re-use meshes in certain places. Sometimes, if we require a “mirrored” look we’ll reuse a mesh, and then set the scale to -1. This was before we really looked into rendering performance, and, unfortunately, it causes problems – a mesh with negative scaling can’t be batched with a mesh with positive scaling, so this ends up creating multiple draw calls. Rather than setting the scale of the object to -1, we simply import a new, mirrored mesh and update the object, allowing these draw calls to be batched and improving performance.


4-24-Stats.JPG


Stats

That’s it for the heavy-hitters; between the Profiler, Frame Debugger, and ADB, you should be able to get a pretty good idea of what’s going on in render-land. Unfortunately, digging through them can take a while – sometimes you just want a quick indicator of what’s going on in your scene. Enter the Stats window.

The Stats window (click “Stats” in the Game View) is a small overlay in the game view which gives you a quick rundown of various rendering indicators in real time. It’s not as in-depth, but it gives a much quicker picture of performance.

stats

That’s a lot of batches!

While it sounds like the stats window doesn’t add much – after all, the Profiler can give you the same information – I’ve found it to be very useful. The Profiler is probably better when you’re actively debugging rendering performance, but the stats window allows you to notice places where rendering performance might take a hit, even when you’re doing other things.

When I’m testing some other part of the game on my computer, I’m not going to notice any rendering lag, because my computer is so much more powerful than a phone. I’m also not going to be looking at the Profiler or Frame Debugger, because I’m not worrying about rendering at the moment. However, if I have the stats window open and I notice that the number of draw calls is in the hundreds, then I know something is going on. At that point I can get out the Profiler and see what’s happening – but I wouldn’t even have known there was anything amiss if it weren’t for the stats window.


4-24-SceneView.JPG

Scene View Draw Mode

As we get further and further down the list, we’re moving from “debugging all-star” to “it’s useful, but you probably won’t use it much”. Scene View Draw Modes fall into this category, but they’re still good to know about. You can access different Scene View Draw Modes by clicking the drop down menu at the top right of the scene view window.

The Scene View in Unity is one of the main windows that you use to make your game – it shows everything in the scene, allowing you to move around through the scene and select, move, rotate, scale, etc., any game objects. Usually the Scene View just displays the objects exactly as they would be displayed in the game. However, it has a bunch of other modes, and some of them are actually pretty useful. The two that I find the most useful when considering rendering concerns are listed below, although they’re all worth checking out:

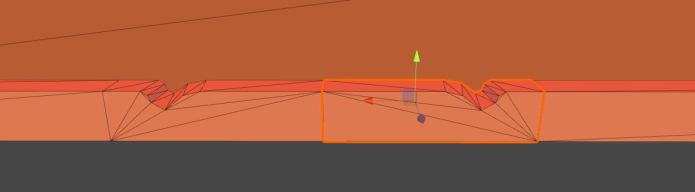
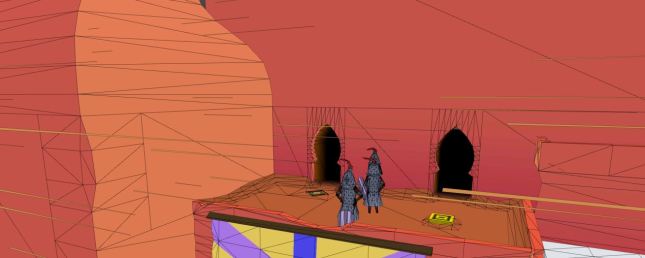
Shaded Wireframe: This is my default draw mode, as it looks pretty similar to the normal shaded mode. The difference is that it also shows all of the triangles and vertices that you’re drawing. This is useful because certain shader operations are performed once for every vertex. Decreasing the number of vertices in your scene can give you a bit of a performance boost, and the shaded wireframe draw mode helps you see when you might have too many vertices.

3-4toomanytris

The shaded wireframe shows that there are too many polys.

Overdraw: This mode draws each object as a single transparent color. This makes it very easy to see when multiple objects are being drawn in the same spot on the screen. Since the GPU has to draw every pixel of each object (even if that pixel will be overwritten later), it ends up wasting some calculations. Areas that are very bright will waste even more calculations. Switching to this draw mode every so often lets you know if there are any places where you might want to remove some meshes.


161004-worst-hacks-history-feaure

The Internet!

It should pretty much go without saying, but one of your best resources for debugging performance is the internet. Unfortunately, when it comes to rendering in Unity, the information out there is pretty scarce. Unlike with normal imperative coding, where you can simply Google “how to pathfinding” and get 30 implementations, you have to work a bit harder with rendering stuff. I find it’s best to do what you can and only resort to the internet with very specific questions. That said, there is still a lot of helpful information out there. You just have to know going in that only one of every three stack overflow questions makes any sense, and only one of every four Unity forum threads are using the most recent APIs. It’s like “Googling: Nightmare Mode”!

For anyone reading this post who is actually working on rendering stuff – I’m very, very sorry. I hope that this post and the tools I discussed help to shed at least a little bit of light in the dark underworld that is shader-land, and I hope you can achieve your rendering goals and make it back to the mortal realm before your soul is forever lost.

For everyone else who hasn’t done any rendering stuff, I hope you learned a bit, and that maybe I inspired you to get involved with some rendering code! It’s really not that bad, I promise!


= = = = = = = = = = = = = = = = = = = = = = = = = = = = = = = = = = = =

If you didn’t already have a working knowledge of rendering, I hope this post helped! If you do know about rendering stuff, I hope you don’t hate me too much for my imprecision! You can always find out more about our game at WhereShadowsSlumber.com, find us on Twitter (@GameRevenant), Facebookitch.io, or Twitch, join the Game Revenant Discord, and feel free to email us directly with any questions or feedback at contact@GameRevenant.com.

Jack Kelly is the head developer and designer for Where Shadows Slumber.

Rendering in Unity

As you probably know, Where Shadows Slumber is starting to ramp up toward a release this summer. It’s an exciting, terrifying time. We can’t wait to share the entirety of what we’ve been working on with the world, but there’s also a daunting amount of stuff to do, and not much time to do it.

If you’ve played any of the recent beta builds, hopefully you like what you’re seeing in terms of design, functionality, polish, art, and sound. Unfortunately, if you’ve played the beta on anything other than a high-end device, you’ve probably noticed something that you don’t like: lag.

Lag is annoying. Lag is something that can take a great game and ruin it. It doesn’t matter that your level design is perfect, your models are beautiful, and your music is entrancing if it only runs at 10 frames per second. If that’s the case, nobody is going to enjoy playing it. And, regrettably, that happens to be the case for Where Shadows Slumber.

LikeButta

Like butta’!

So, one of my biggest tasks before we release is to optimize the game, making it run faster and allowing us to have higher frame rates. The area with the most opportunity for improvement is during rendering. A game consists of a lot of logic – Obe’s location, things changing in shadow, etc. – but rendering is the process of actually drawing the scene onto the pixels of your screen.

Earlier this week, I started a post about the different tools you can use to help optimize your rendering performance. It seemed like a good idea, since that’s exactly what I was doing. However, I realized that if you don’t know how rendering works in the first place, most of it is complete gibberish. So I’m gonna leave that post for next week, and this week I’ll give a quick introduction to how 3D rendering works in Unity.

Blog-Render.JPG

Rendering

Rendering is the process by which the objects in your game are drawn to the screen. Until it’s rendered, an object in your game is just a collection of information about that object. That information gets translated from information the game engine understands into information the GPU can understand. There are a few important concepts to understand here:

  • An object’s mesh describes the shape of the object. It consists of a collection of vertices and triangles.
  • An object’s material is a description of how that object should be drawn. It encapsulates things like colors and shininess.
  • Every material uses a shader. This is the program which calculates exactly what color each pixel should be, based on the information in the mesh and material.
  • World space is the 3D coordinate space in which all of your game objects live.
  • Screen space is a 2D coordinate space that represents the screen to which the game is drawn.

The basics of rendering are pretty easy to understand, at least from a high-level view. The meshes for the objects in your game are translated from world space to screen space, based on the camera that’s doing the rendering. For instance, in Where Shadows Slumber, objects that are further away in the x-axis will be higher up and more to the right when viewed on the screen. Fortunately, we don’t have to mess with this too much – Unity’s cameras do a good job of making this translation.

Once we know where each pixel should be drawn, we need to determine what color that pixel should be – this is where the material and shader come in. Unity provides a whole bunch of information to the shader (position, angle, information about lights in the scene, etc.). The shader uses that information, plus the information from the material, to determine exactly what color the given pixel should be. This happens for every pixel on the screen, resulting in a beautiful picture of exactly what you expect to see.

The GPU

Now that we understand the basics of rendering, let’s take a deeper look into how it actually happens: the GPU.

The GPU, or graphics processing unit, is the part of the computer in charge of calculating the results of our shaders to determine a pixel’s color. Since modern phones have over 2 million pixels, our shader code must be run over 2 million times per frame – all within a fraction of a second.

How does the GPU manage to do so many calculations so quickly? It’s due to the design of the GPU, and can be summed up in one very important sentence: the GPU is good at performing the same operation, a bunch of times, very quickly. The key thing to remember here is that it’s good at performing the same operation; trying to perform different operations is what slows it down.

Specifically, switching from one material to another causes a bit of a hiccup in terms of speed. The properties of the material are passed to the GPU as a set of parameters in what is known as a SetPass call. SetPass calls are one of the first and most important indicators when it comes to optimizing rendering performance, and are often indicative of how quickly or slowly your game will run.

Because SetPass calls take so long, Unity has a strategy for avoiding them called batching. If there are two objects that have the same material, that means they have the same parameters passed to the GPU. This means that those parameters don’t need to be reset in between drawing the two objects. These two objects can be batched, so the GPU will draw them at the same time. Batching is Unity’s first line of defense against rendering slowness.

The CPU

While the GPU is the star of the show when it comes to rendering, the CPU, or central processing unity, still does some important stuff that’s worth mentioning (even if it doesn’t have a huge bearing on the optimization steps we’ll be taking). Of course, the CPU is in charge of running your game, which includes all of the non-shader code you’ve written for it, as well as any under-the-hood things Unity is doing, like physics and stuff.

The CPU does a lot of the “set up” for rendering, before the GPU comes in and does the heavy number-crunching. This includes sending specific information to the GPU, including things like the positions of lights, the properties of shadows, and other details about the scene and your project’s rendering config.

One of the more important rendering-related things the CPU does is called culling. Since the CPU knows where your camera is, and where all of your objects are, it can figure out that some objects won’t ever be viewed. The GPU won’t know this, and will still perform calculations for those objects. In order to avoid doing these unnecessary calculations, the CPU will first remove any of the objects that won’t be drawn, so the GPU never even knows about them.

Image

All of these Hitlers would be culled by the CPU (image credit: smbc-comics.com)

Since we’re talking about performance, it should be noted that the GPU and the CPU are two different entities. This means that, if your game is experiencing lag, it’s likely due to either the GPU or the CPU, but not both. In this case, improving the performance of the other component won’t actually make your game run any faster, because you’ll still be bottlenecked by the slower process.

So, now that we know a little bit more about how rendering actually happens, maybe we can use that knowledge to improve performance! At least, that’s what I’m hoping. If Where Shadows Slumber never comes out, then you’ll know I’ve failed. Either way, I’ll see you next week for a look into the tools you can use to help you optimize rendering performance in Unity!


= = = = = = = = = = = = = = = = = = = = = = = = = = = = = = = = = = = =

If you didn’t already have a working knowledge of rendering, I hope this post helped! If you do know about rendering stuff, I hope you don’t hate me too much for my imprecision! You can always find out more about our game at WhereShadowsSlumber.com, find us on Twitter (@GameRevenant), Facebookitch.io, or Twitch, join the Game Revenant Discord, and feel free to email us directly with any questions or feedback at contact@GameRevenant.com.

Jack Kelly is the head developer and designer for Where Shadows Slumber.

Where Shadows Slumber at PAX 2018’s Indie Minibooth

I’ve just returned from an exhausting trip to Boston for PAX East, where I had the pleasure of demoing Where Shadows Slumber at the Indie Megabooth. In this blog post, I’ll briefly describe what the application process was like, how the show went, and my thoughts on the whole setup.


0 - IMB.jpg

Applying to the Indie Minibooth

Those who have followed our development for the past year may remember that we went to PAX East last year, as part of the Indie Showcase for 2017. It was an honor to be included in that amazing contest! Reading that old blog post is funny, because it shows you just how far we’ve come in the past year. At that time, the cutscene in our demo hadn’t even been animated yet! (Which is completely my fault, lol) It’s amazing to think that now, a year later, the game is nearly complete.

Anyway, we knew we wanted to return to Boston because the crowd at PAX East is huge, but we had a predicament. How do you get an affordable spot at the show? We didn’t want to be relegated to the fringes of the expo hall, which is where they usually place you when you buy a booth on your own. We obviously couldn’t be accepted into the Indie Showcase a second time, (although we are totally going to try for PAX West’s competition) so what were our options?

We heard about the Indie Megabooth because of last year’s PAX – they were right near us, and the space was impressive. We decided to apply via their website, and on November 6th, 2017 we submitted our application for their booth at PAX East 2018 and GDC 2018. The application was essentially a pitch for the game, complete with images, video, and a build their judges could play.

Although we were denied for GDC 2018, we got an email on February 1st of this year notifying us that we were accepted and we needed to reply as soon as possible. We paid the $1,200 fee toward the end of the month, which covered everything from booth space, shelving, promotion, and electricity at the show. All of this was very secretive, which is why we didn’t mention it on this blog or on social media. They wanted the roll-out to be all in unison, so they told developers not to spill the beans that they had been accepted.

I decided that since the space around the Minibooth was so limited, it wasn’t worth bringing a ton of stuff in my car. Instead, I took the train up to Boston on Friday and began to set up for the show!


2 - Setup.jpg

The Setup

The setup for the Minibooth is a vertical kiosk with a table, and a monitor on top. Our setup looked like the image above: just enough room for mobile devices, Where Shadows Slumber pins, and drop cards. The monitor was playing a 10 minute looping video reel I created prior to the show.

20180406_183246.jpg

Here we are on Friday night, setting up for the weekend. Minibooth was created to be a more affordable way to attend events, so it’s set up in kind of a strange way. The Minibooth arcade had 10 games on Thursday and Friday, and then we moved in to take their spot on Friday night so we could take over for the weekend shift.

I don’t know how this is decided, but I do remember choosing our preferred days on the application form. Personally, I think the weekend spot is way better and I do sort of feel bad for the Thursday/Friday crew. But I guess the logic is that Thursday and Sunday are both slow, and Friday and Saturday are both crazy, so everyone gets one of each. I feel like we got really solid traffic on both days, but Sunday definitely died out at around 3 pm. Hopefully everyone got their moneys worth!


20180406_215257.jpg

They Threw Us A Party!

This was a nice perk that I didn’t even expect, but there was an Indie Megabooth mixer just a few blocks from the convention center on Friday night. The timing worked out well, since both Minibooth groups were in town at that point. I still kind of feel like an outsider at these events, so I can’t pretend I did a whole lot of “networking” – still, I appreciate the effort to get a nerd like me out of his shell! There was even free food and an open bar. What more can you ask for? [ ^_^]


20180408_114251.jpg

Let The Show Begin!

The two days of the Minibooth were exhausting, in a good way. Standing on your feet for 8 hours straight two days in a row is not exactly what I’m used to as a nerdy computer artist. But it was for a good purpose! The traffic during these PAX shows is always really consistent. There was never a dull moment, which is exactly what you want. This is probably due to the good reputation of the Indie Megabooth, but it also didn’t hurt that the Megabooth is in the center of the giant convention hall next to two giant avenues. We never felt “out of the way” or like we were in an obscure part of the space.

No one found any errors that we didn’t already encounter at SXSW, since we brought the same build. (The shows were too close together to worry about rebuilding) I also made a point to not really ask for feedback, and instead pitched the demo, our beta, and this blog. It’s good to know going into a show what you’re looking to get out of it. This one was purely about promotion.

20180408_170101.jpg

(Chris put a grip tape line down between our booths because the crowd was out of control!)

These shelves were super useful, because the customers couldn’t see them and they made good use of the limited space. I might buy some for Game Revenant to use during future shows. Typically when we go to conventions, Jack is the Charger Master and we’re constantly rotating a few devices between a few limited charging stations. (At SXSW, we actually used the MacBook as just a power brick LOL) I was nervous about handling this show on my own at first. However, having power provided for us – along with my power strip and these shelves – made it a breeze! The devices were always topped off and no one had to be turned away.


20180408_191406.jpg

It’s Over!

Overall, the Indie Minibooth seemed like a great investment of time and money, and I highly recommend it. (I even recommended it to other developers while I was at the show!) The caveat is that it will cost you a non-trival amount of money to secure the Minibooth spot and get a hotel, so plan accordingly. If you want your indie game to succeed, you need to take a financial risk like this eventually.

If you found out about this blog because you met me at the Indie Minibooth, welcome! Take a journey backward through time and check out all of our other posts. We’ve been posting a blog every week for over a year, so if you’re curious about anything related to this game, chances are good that we’ve covered it in-depth already. It also goes without saying that official announcements about the game’s release date will be posted to this feed, so be sure to smash that follow button if you have a WordPress account.

Hope to see you all next year at PAX 2019!


= = = = = = = = = = = = = = = = = = = = = = = = = = = = = = = = = = = =

Thanks for reading this blog! Stay tuned for more updates and announcements related to Where Shadows Slumber. You can find out more about our game at WhereShadowsSlumber.com, ask us on Twitter (@GameRevenant), Facebookitch.io, or Twitch, and feel free to email us directly at contact@GameRevenant.com.

Frank DiCola is the founder of Game Revenant and the artist for Where Shadows Slumber.

State of the Art – April 2018

Welcome to State Of The Art, April 2018 edition! This monthly progress report is written by Frank DiCola and is focused entirely on how the game’s visuals have improved in the past month.

Missed last month’s State of the Art? The March edition is right here.

Also, don’t be fooled by our last blog post. The “Easter edition” of our blog was actually just the Where Shadows Slumber April Fool’s gag for the year. We hope it gave you a few laughs! Don’t worry, we aren’t adding any of that stuff to the game.

SOTA-Discord

Sorry Caroline – no skins!

We all had fun making that, but now it’s back to work. Here’s the State of the Art!


SPOILER WARNING: This post contains screenshots, GIFs and videos of later sections of the game. If you want to experience them in all their majesty for the first time on your mobile device when the game launches, don’t read on!


SOTA-Header.png

Mustard River

The infamous “mustard river” is now complete! These Levels used to be in real rough shape, but now I love the way our ashen rocks contrast with the yellow of the water. This World is home to Walkers, a mechanic we introduce in the first River Level. I won’t drone on too long, because I think these GIFs speak for themselves. Enjoy!

River1.gif

Level 2-1, “Docks”

River2.gif

Level 2-2, “Cage”

River3.gif

Level 2-3, “Guide”

River4.gif

Level 2-4, “Ebb”

River5.gif

Level 2-5, “Ferry”

There are new Walkers, too! For a long time, the denizens of the River were weird copies of Obe in scraggly shorts. As you may have noticed from the GIFs above, I gave them a bit more unique personal features, such as different hats or clothing. Overall, they probably still look too much like generic video game zombies. Regardless, I hope people will realize as they play the game that these Walkers are to be pitied, not feared.


SOTA-LevelSelectHeader.png

Check Out Our Snazzy Level Select Menu

I’m really proud of the Level Select menu that Jack and I have been working on together. Rather than just do a few buttons with numbers on them, we really went all out to create a beautiful experience that takes you through the story of the game as you choose what Level you’d like to play. Check them out in action!

LevelSelects.gif

When the full game is done, this menu will be the best place to track your progress. How many Levels have you completed? How many are left? Which ones would you like to return to, to show your friends? During gameplay however, the Player won’t be directed here too often, since Levels flow directly from one into the other.


SOTA-HomeStretch.png

Polish: The Home Stretch

I have begun the process of finishing the game’s final 15 Levels. These puzzles have been finished for a while, and they even have some “first draft” art. However, as I say all the time, my goal for each Level is to make it look like my favorite Level, and make the player say “oh wow, I love the look of this one.” That’s a delicate process that takes a lot of time – many, many hours spent per Level!

CemeteryRain


So right now I have just one of the final 15 to show you today, and you can see it above. This is in World 5, The Hills, and it’s called Cemetery. It features tombstones that turn into ghosts when you cover them in shadow. The theme of the World is putting these spirits to rest in their graves.

This Level is nearly complete – there are two tiny touches I’m dying to put in. First, I want to give that Draggable pillar a bit more personality. Right now it’s just a green hyperrectangle (Jack taught me that’s what a 3D rectangle is) but it should feel like it belongs more. Second, I want to add animated blades of grass that bounce and bob along with the rhythm of the falling rain. Personally, I think making convincing rain is more about the effect the raindrops have on the ground rather than seeing actual particles in midair. When it rains in real life, what’s easier to see: the rain in midair as it falls to Earth, or the water collecting in puddles on the ground or forming little rivers? Observe the world around you next time there’s a storm. I’m right!

Anyway, those changes all take a lot of love so I’ll be poring over it more this week before I head off to PAX East!


SOTA-iPhoneX

Last But Not Least – The iPhone X!

I finally bit the bullet and purchased the iPhone X so we can test how the game works on its sleeker, thinner, taller (!) screen. The phone is beautiful and feels great, and you can see a proof of life photo above. Jack will probably have to do some programmer-fu to make the camera zoom out a bit on these phones, but that’s fine. I love playing on the iPhone X because of how smooth it is, so a little camera troubles are no problem at all!

That’s about it for this month’s art update. I wish I could have gotten a bit more done, but we had to attend SXSW earlier this month and I spent a lot of time preparing the art for that build. It was a great show, but travel always takes time away from being in the “flow” of creating artwork. Since I’ll be at PAX East this weekend, you can expect the same lame excuse next time!

We’re nearing the final days of working on Where Shadows Slumberwhich is a really weird thing to think about. I suppose we’ll still be doing a lot of post-launch stuff, but I’m not sure what I’ll do all day, every day once the game is done. Anyway, I know what I’ll be doing all day, every day in April… [ o_o] ART!

See you next month for another update!


= = = = = = = = = = = = = = = = = = = = = = = = = = = = = = = = = = = =

We hope you enjoyed this update about the game’s artwork. Have a question about aesthetics that wasn’t mentioned here? You can find out more about our game at WhereShadowsSlumber.com, ask us on Twitter (@GameRevenant), Facebookitch.io, or Twitch, and feel free to email us directly at contact@GameRevenant.com.

Frank DiCola is the founder of Game Revenant and the artist for Where Shadows Slumber.